How do you calculate standard deviation step by step?
To calculate standard deviation, find the mean, subtract it from each value, square each difference, and add the squares. Divide that total by the number of values, which gives the variance. Finally, take the square root of the variance. The result is the standard deviation, back in the original units of the data.
Example
Two teams of 8 players answer the same quiz with 10 questions. Take Team B, whose scores are 2, 4, 4, 4, 5, 5, 7 and 9.
- Find the mean. 2 + 4 + 4 + 4 + 5 + 5 + 7 + 9 = 40, and 40 ÷ 8 = 5
- Subtract the mean from each value. This gives −3, −1, −1, −1, 0, 0, 2, 4
- Square each difference. This gives 9, 1, 1, 1, 0, 0, 4, 16
- Add the squares. 9 + 1 + 1 + 1 + 0 + 0 + 4 + 16 = 32
- Divide by the number of values. 32 ÷ 8 = 4, which is the variance
- Take the square root. √4 = 2, so the standard deviation is 2
The same working, value by value, makes it easier to keep track.
- 2 − 5 = −3, and (−3)² = 9
- 4 − 5 = −1, and (−1)² = 1, three times
- 5 − 5 = 0, and 0² = 0, twice
- 7 − 5 = 2, and 2² = 4
- 9 − 5 = 4, and 4² = 16
Notice that the differences themselves, −3, −1, −1, −1, 0, 0, 2 and 4, add up to 0. That always happens, and it explains the squaring step, as the next section shows. The last step needs a square root, and a few rounds of square roots make those much quicker to estimate in your head.
What is the formula for standard deviation?
The population standard deviation is σ = √(Σ(x − μ)² ÷ N). Here x is each value, μ is the mean, N is the number of values and Σ means "add them all up". For a sample taken from a bigger group, divide by n − 1 instead of N. That version is written s.
Example
If Team B is the whole group you care about, use N. The variance is 32 ÷ 8 = 4, and σ = √4 = 2.
If the 8 players are a sample chosen to represent a whole school, use n − 1. The variance is 32 ÷ 7 ≈ 4.57, and s = √4.57 ≈ 2.14.
Why divide by n − 1 for a sample?
A sample usually misses some of the most extreme values in the full group, so its spread tends to come out a little too small. Dividing by n − 1, a slightly smaller number, makes the result a little larger and corrects for that. With large samples, the difference between the two versions becomes tiny.
Calculators and spreadsheets often offer both versions. A button or function marked σ or "population" divides by N, and one marked s or "sample" divides by n − 1. Check which one a teacher or textbook expects, because both are correct in their own situation.
Why do you square the differences in standard deviation?
The differences from the mean always add up to zero, because the values above the mean balance the values below it. Squaring makes every difference positive, so they no longer cancel out. The square root at the end then brings the result back to the original units, so a spread in points is measured in points.
Example
For Team B, the differences were −3, −1, −1, −1, 0, 0, 2 and 4. Their total is 0, so their plain average is 0 too, which says nothing about the spread. After squaring, they become 9, 1, 1, 1, 0, 0, 4 and 16, which add up to 32.
Squaring also gives far-away values more weight. The NIST Engineering Statistics Handbook gives a clear illustration. A point 2 units from the mean adds 4 to the total, while a point 10 units away adds 100. That makes standard deviation sensitive to a single extreme value, such as one score of 0 in a group that otherwise scored well.
There is a simpler measure that skips the squaring. The mean absolute deviation takes the distance of each value from the mean, ignores the minus signs and averages them. For Team B, the distances 3, 1, 1, 1, 0, 0, 2 and 4 add up to 12, and 12 ÷ 8 = 1.5. It is easier to calculate by hand, but standard deviation is the measure most statistics tools and formulas build on.
What is a high or low standard deviation?
There is no single number that counts as a high or low standard deviation. It depends on the size of the values and what they measure. A standard deviation of 2 points is large for quiz scores out of 10, but tiny for scores out of 1,000. Compare it with the mean and with the range of possible values.
Example
Now compare Team B with Team A from the same quiz.
- Team A: 3, 5, 5, 5, 5, 5, 5, 7
- Team B: 2, 4, 4, 4, 5, 5, 7, 9
Both teams have a mean of 5, because each list adds up to 40 and 40 ÷ 8 = 5. But Team A's scores huddle around 5, while Team B's are scattered from 2 to 9. Team A's standard deviation is 1 point, and Team B's is 2 points.
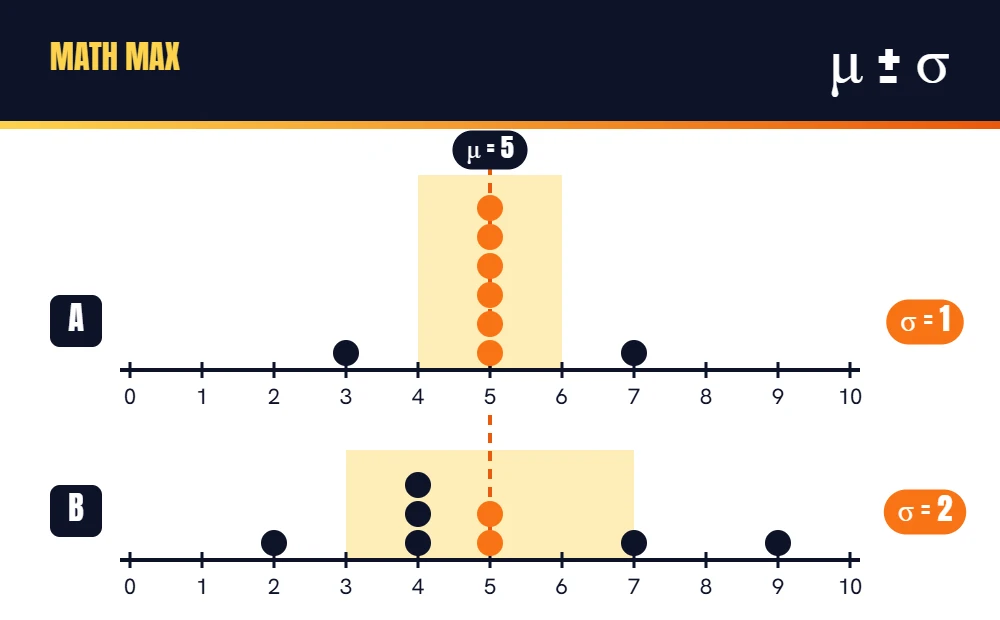
The average alone would make these teams look identical. The standard deviation shows that Team A is very consistent, while Team B has some players far ahead and some far behind.
Another example
Two bakeries both sell loaves with an average weight of 500 g. At the first, the standard deviation is 5 g, so almost every loaf weighs close to 500 g. At the second, it is 40 g, so some loaves are noticeably lighter and some heavier. The averages match, but the first bakery is far more consistent.
A low standard deviation is not always better. In a classroom, a high standard deviation in test results can simply show that children are at very different stages, which is useful for a teacher to know. In a factory, a low standard deviation usually means the machines are reliable. The number describes the spread, and the context decides whether that spread is good news.
A standard deviation can never be negative, because it comes from a square root of squared numbers. It is 0 only when every value is the same.
What does the 68-95-99.7 rule mean?
For data that follow a normal distribution, the familiar bell-shaped curve, about 68% of values lie within one standard deviation of the mean. About 95% lie within two standard deviations, and about 99.7% within three. This is called the empirical rule, and it turns a standard deviation into a quick picture of the data.
Example
Suppose the times for a 1 km run in a large group follow a bell curve with a mean of 6 minutes and a standard deviation of 1 minute. Then about 68% of runners finish between 5 and 7 minutes. About 95% finish between 4 and 8 minutes, and almost everyone finishes between 3 and 9 minutes.
The rule only works well for bell-shaped data. Small groups, like the two quiz teams, rarely follow it closely. For lopsided data, such as incomes or waiting times, the mean and standard deviation can give a misleading picture, and the median and range often describe the data better.

The mean is the starting point of every standard deviation, so it helps to work out averages quickly. In the statistics game, each attack in a fight is a statistics question, so finding a mean in your head becomes part of winning a round. Short, frequent rounds build that speed better than one long session.
Standard deviation is the typical distance from the mean
Standard deviation answers one question. How far from the average is a typical value? Use these steps whenever you need to find it by hand.
- Find the mean.
- Subtract the mean from each value.
- Square each difference.
- Add the squares.
- Divide by N for a whole population, or by n − 1 for a sample.
- Take the square root.
A small answer means the values are close together, and a large answer means they are spread out. Always read it next to the mean and the units, because a spread only makes sense in context.
Train these next