A multiplication chart is a grid that shows the answer to every times table fact in one place. Most children see it as a list of numbers to learn. Look a little closer and it is full of patterns, and those patterns are what turn a chart from a crutch into a real way of understanding multiplication.
How do you read a multiplication chart?
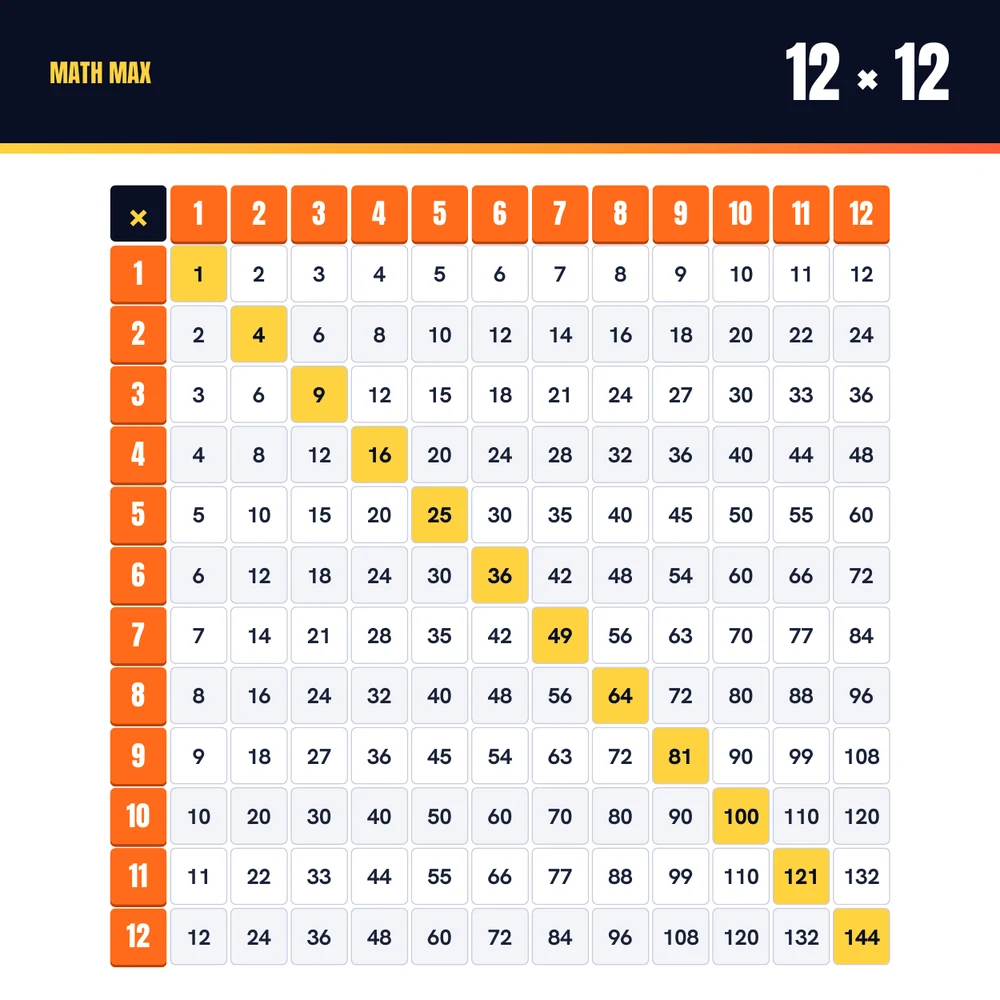
To read a multiplication chart, find the first number in the column down the left side and the second number in the row across the top. Follow that row across and that column down until they meet. The number in that square is the answer. Row 6 and column 7 meet at 42, so 6 × 7 = 42.
Example
Your child wants to know 4 × 9. Put one finger on the 4 in the left column and another on the 9 in the top row. Slide the first finger to the right and the second finger down. They meet on 36, so 4 × 9 = 36. Here is every row of the chart up to 12 × 12. Each row lists the answers for that number times 1 to 12.
- Row 1: 1, 2, 3, 4, 5, 6, 7, 8, 9, 10, 11, 12
- Row 2: 2, 4, 6, 8, 10, 12, 14, 16, 18, 20, 22, 24
- Row 3: 3, 6, 9, 12, 15, 18, 21, 24, 27, 30, 33, 36
- Row 4: 4, 8, 12, 16, 20, 24, 28, 32, 36, 40, 44, 48
- Row 5: 5, 10, 15, 20, 25, 30, 35, 40, 45, 50, 55, 60
- Row 6: 6, 12, 18, 24, 30, 36, 42, 48, 54, 60, 66, 72
- Row 7: 7, 14, 21, 28, 35, 42, 49, 56, 63, 70, 77, 84
- Row 8: 8, 16, 24, 32, 40, 48, 56, 64, 72, 80, 88, 96
- Row 9: 9, 18, 27, 36, 45, 54, 63, 72, 81, 90, 99, 108
- Row 10: 10, 20, 30, 40, 50, 60, 70, 80, 90, 100, 110, 120
- Row 11: 11, 22, 33, 44, 55, 66, 77, 88, 99, 110, 121, 132
- Row 12: 12, 24, 36, 48, 60, 72, 84, 96, 108, 120, 132, 144
Charts in some countries stop at 10 × 10, while others go up to 12 × 12. The patterns below work the same in both.
What patterns are hidden in the multiplication chart?
The multiplication chart is full of patterns. It is symmetrical along the diagonal, the diagonal holds the square numbers, some rows are doubles of others, and many rows have last digits that repeat. Spotting these patterns means a child has far fewer facts to learn, and the facts they do learn make sense.
The chart is a mirror
Find 3 × 8 and then 8 × 3. Both squares say 24. The whole chart is a mirror image along the diagonal from the top left to the bottom right, because the order of the numbers doesn't change the answer.
This one pattern roughly halves the work. Leave out the easy facts for 0, 1 and 10, and the facts from 2 × 2 to 9 × 9 come down to only 36 different ones.
The diagonal holds the square numbers
The squares on the diagonal are 1, 4, 9, 16, 25 and so on. Each one is a number multiplied by itself, so they are called square numbers. Each step down the diagonal adds the next odd number. 1 plus 3 is 4, plus 5 is 9, plus 7 is 16.
The 2s, 4s and 8s double each other
Every number in the 4s row is double the number above it in the 2s row. The 8s row is double the 4s row. So a child who knows 2 × 7 = 14 can find 4 × 7 by doubling to 28, and 8 × 7 by doubling again to 56. The same link works between the 3s and the 6s.
The 5s and 10s end the same way
Every answer in the 10s row ends in 0. Every answer in the 5s row ends in 5 or 0, taking turns. And each 5s answer is half of the 10s answer below it. 5 × 8 is half of 10 × 8, so it is 40.
In the 9s, one digit goes up while the other goes down
Read the 9s row up to 90. The answers are 9, 18, 27, 36, 45, 54, 63, 72, 81, 90. The tens digit goes up by one each time and the ones digit goes down by one. The two digits always add up to 9, which is a quick way to check an answer.
The 3s have a digit sum pattern
Add the digits of each answer in the 3s row. 12 gives 3, 15 gives 6, 18 gives 9, 21 gives 3 again. The digit sums go 3, 6, 9, 3, 6, 9 all the way along. Their last digits are also interesting, because from 3 × 1 to 3 × 10 they use every digit from 0 to 9 exactly once.
The 11s repeat the digit
Up to 11 × 9, every answer is the digit written twice. 11 × 4 = 44 and 11 × 7 = 77. After that the pattern changes (110, 121, 132), which is a good moment to point out that patterns can have limits.
Every row steps evenly
Each row goes up by the same amount every time. The 7s row goes up by 7, the 12s row by 12. So if your child forgets 7 × 8, they can start from a fact they know, such as 7 × 7 = 49, and add one more 7 to get 56.
How can a multiplication chart help your child learn the times tables?
A multiplication chart helps most when your child uses it to work out facts rather than to look them up. Let them find an answer from a known fact first, then check it on the chart. Over time they need the chart less, because the patterns and links between facts do the work.
Example
Your child doesn't know 6 × 8. They do know 5 × 8 = 40. Six eights is one more eight than five eights, so 6 × 8 = 40 + 8 = 48. Now they check the chart and see 48. They have not just found an answer, they have practised a strategy they can use for any fact.
A few other ideas work well at home:
- Colour in the facts your child already knows. Seeing a chart that is already half coloured is very encouraging.
- Draw an empty grid and let your child fill it in from memory, one row at a time.
- Cover a few squares with sticky notes and ask your child to work out what is underneath.
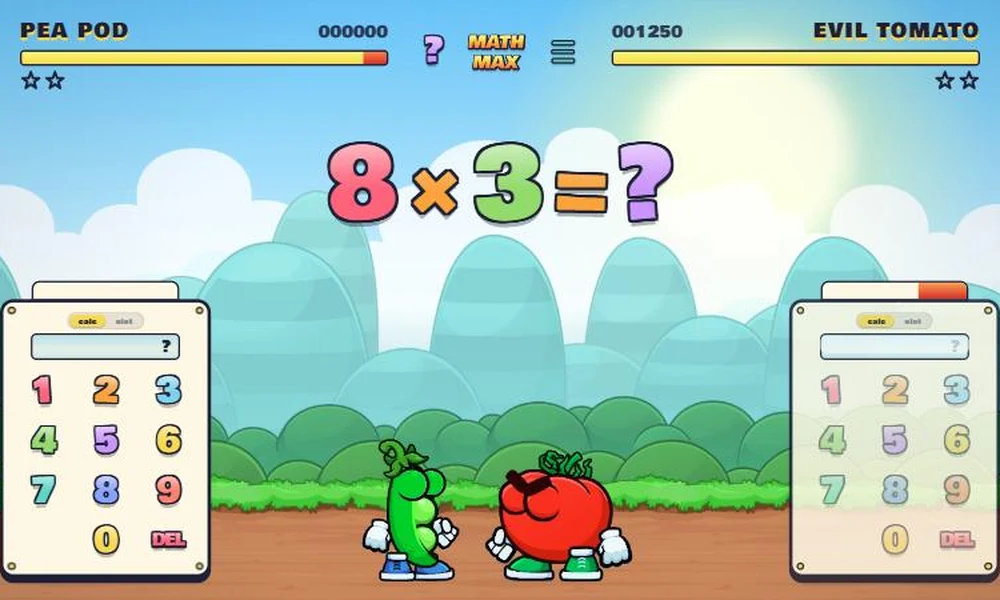
Once the chart starts to feel familiar, short rounds of the multiplication game let your child use the same facts at speed in a playful fight. There are more ideas for building speed in our guide on how to learn times tables fast, and the times tables games page lets your child pick one table to focus on. Short, regular sessions work better than one long one.
Is using a multiplication chart cheating?
Using a multiplication chart is not cheating when it helps your child learn. It becomes a problem only if it replaces learning, so that a child never needs to remember a single fact. The goal is a child who understands how the chart works and slowly needs it less, not a child who is never allowed to see one.
Example
Imagine your child is learning long division. If they spend all their energy on 7 × 8, they lose track of the new method. Letting them use the chart for that lesson keeps the focus on division. When the lesson is about the times tables themselves, the chart goes away.
Many parents worry that a chart becomes a lifelong crutch. That risk is real if the chart is always there and nobody ever asks the child to recall a fact. It is much smaller when the chart is used to spot patterns and then gradually removed.
If your child has trouble with memory or a learning difficulty, a chart may be an agreed support at school. In that case, talk to the teacher about how and when it should be used, rather than taking it away at home.
When should your child stop using the chart?
There is no fixed age, and children are ready at different times. A gentle way to wean off the chart is to remove it in steps:
- Start with the full chart for any task.
- Cover the rows your child knows well, so they only see the facts they are still learning.
- Switch to an empty grid that they fill in themselves before a task.
- Put the chart out of sight and keep it only for checking answers afterwards.
Move to the next step when the current one feels easy. Going back a step on a tired day is fine.
A chart your child understands becomes a chart they no longer need
A multiplication chart is not a list to memorize from top to bottom. It is a map of how numbers work together, with mirrors, doubles and repeating patterns. Help your child see those patterns, use the chart to work out new facts from old ones, and let it fade into the background as their confidence grows.
Train these next